For 55 years, Centralina Regional Council has focused on addressing the needs of member communities in our nine-county area and worked collaboratively on issues that impact our region. We examine national, state and local trends impacting our member governments and identify their potential impacts to determine best practices for meeting needs and addressing challenges. This brief dives into current regional trends and how they are currently being addressed by Centralina, as well as how they will continue to be addressed in upcoming years. The top trends identified include 1) the region’s increase in older adult population; 2) diversifying economic sectors and related employment, education patterns; 3) changing mobility patterns and behaviors; 4) escalating unaffordability in the region; and 5) widening gaps in health and prosperity. These data trends and their impacts were considered in the development of the Centralina FY2023-2024 workplan.
Population
The total population of the Centralia region increased by 19% between 2010 and 2021.1 This growth, however, is not evenly distributed across age groups. Regionally, the largest population growth occurred in the older adult population, with a 44% population increase among the 55+ age cohort1. In comparison, there was an 8% population increase among the 0-19 age cohort and a 14% increase among the 20-54 age cohort1. Similar rates of growth were seen across all nine counties, showing that this growth rate is happening in each corner of our region.
The population increase in older adults is reported to be caused by aging baby boomers, low fertility rates, increased longevity and migration. North Carolina Department of Health and Human Services Division of Aging and Adult Services forecasts that our region’s 65+ population will increase by 54% by 2041, indicating that the region’s population of older adults will more than double in less than two decades. This growth is regionally impactful because there will be an increased need for local and regional services for older adults.
How We Will Help:
Centralina will need to be more responsive, more creative and innovative in how we meet the need for increased services across the region for older adults. At the local level, our Centralina Area Aging on Aging (AAA) staff will work together with member governments to plan for age- and dementia-friendly communities, as recently directed by the May 2023 Executive Order 280, and ensure that our region’s local government services are accessible to all (workplan goal 2, strategy 2, action item 6). Additionally, Centralina will host six events for local governments, Centralina AAA volunteers and communities to inform and educate audiences about pressing aging and older adult issues (workplan goal 2, strategy 3, action Item 4).
Economy
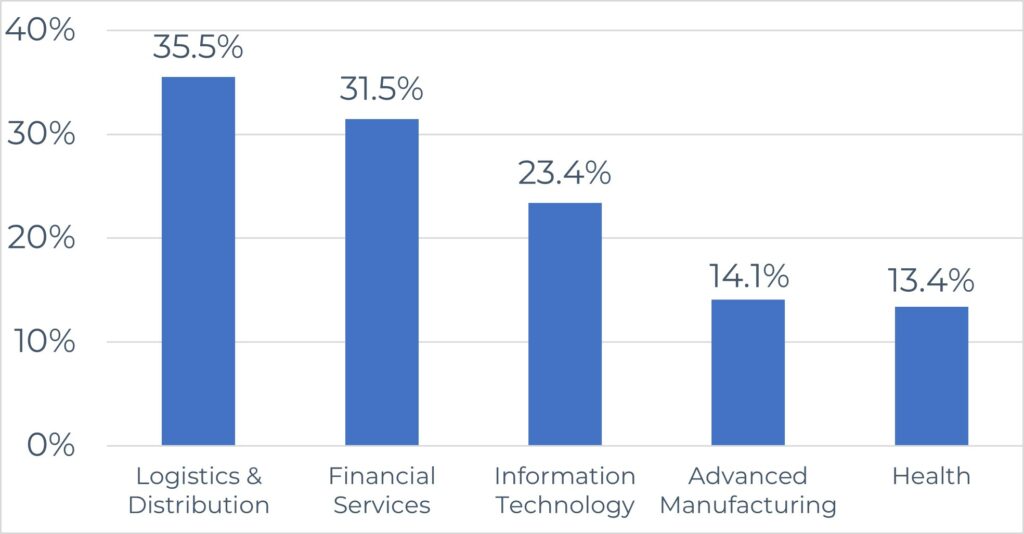
Pre-pandemic, the region saw a 15.1% regional employment growth, compared to an 8.4% employment growth across the U.S. The top five industry clusters2 in our region continue to grow to varying degrees across all counties. Our top industry clusters in the region include:
- Advanced Manufacturing
- Financial Services
- Health
- Information Technology
- Logistics and Distribution
These high growth industries are present in all nine counties and feature jobs across a range of skill levels. The figure below shows the growth in employment from 2014-2019 in these industry clusters. It is evident that logistics and distribution grew the most and our largest employment sector, health or healthcare, grew by 13%. Total job growth accounts for 40% of all jobs created in the region during this time and contributed to our region’s ranking as the fourth fastest growing metro in the US pre-pandemic.
Looking at our higher education trends between 2010-2021, there was an overall decrease in enrollment, but not a corresponding decrease in graduation rates, which is a positive indicator. There is, however, a growing mismatch in terms of the types of degrees and fields graduates are interested in. Looking at the amount of science, technology, engineering and math degrees (STEM), the Centralina region is ranked last compared to the major metros that were benchmarked against. Places like Austin, Nashville, Denver and Raleigh are outpacing us with STEM degrees that lead to higher paying jobs that are less at risk for automation.
How We Will Help
These data points indicate the need for continued support for local economic development policy and projects that add to the region’s economic diversity. One of our strategies under goal one of our workplan is focused on workforce development initiatives and includes a seven-part action item plan. Our Centralina Economic Development District and Centralina Workforce Development Board staff will work with education partners to looks for opportunities to reskill and upskill workers and proactively engage businesses to help them plan for AI and automation transitions. This includes utilizing our Centralina Career Pivot data portal to identify new career pathways for those seeking more stable employment. We will also support efforts to increase STEM degree graduation rates to build a workforce pipeline for high-wage, high skill jobs in our region. Finally, we will host regional best practices roundtables to exchange information and establish a talent working group to facilitate collaboration across the region’s workforce boards, community colleges and economic development organizations.
Mobility
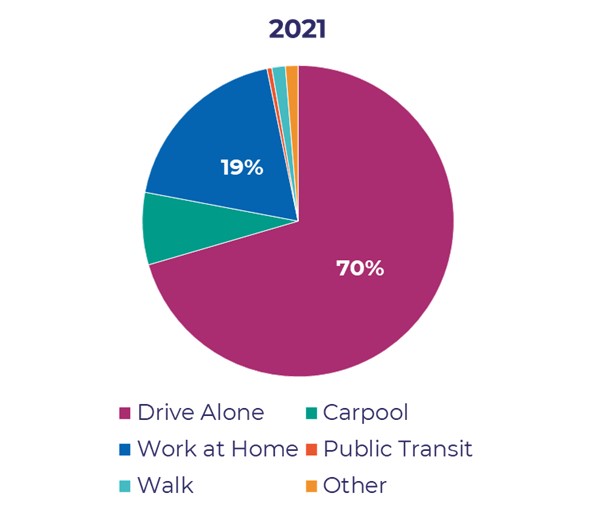
Commuting patterns are changing across our region. Residents are increasingly working where they live and commuting less in favor of working from home. In fact, since 2010, 15% more workers are working remotely or at home full-time. From 2020-2021, remote work among NC residents grew over 20%, indicating that “work from home” is here to stay even past mandated pandemic safety guidelines. This trend underscores the importance of local placemaking and mobility connections for non-commute trips.
Our workforce also continues to live and work in different counties with 49% of residents commuting to jobs outside of the county they live in. This trend signals a continued importance in investing in transportation at the regional level. At the local level, encouraging a mixture of housing and commercial development in communities will allow residents to live closer to where they work, which will have the added benefit of cutting down on commuter congestion.
Additionally, the figure below indicates that there are fewer people driving alone to work compared to 2010 (11% decrease). According to regional vehicle registrations from 2019 – 2022, there has also been a 5% growth in non-vehicle households and a 75% growth in hybrid and electric vehicles (EV). These changes in commuter behavior are a positive sign for our region.
How We Will Help
The data shows the increasing importance of Centralina’s work to expand to mobility choices and commuter connections so communities can support “live where you work” development. Centralina will continue planning and implementation efforts to expand mobility options as outlined in the CONNECT Beyond regional mobility plan and listed in strategy one under goal one of our workplan. This includes the development of a TDM (transportation demand management) program and other high-priority CONNECT Beyond items like the Seamless CONNECTIONS initiative and increasing cross-system coordination among human services transit providers. Centralina will also work with Centralina Clean Fuels Coalition to expand and coordinate local and regional charging networks to accommodate the growing rate of EV ownership.
Cost of Living
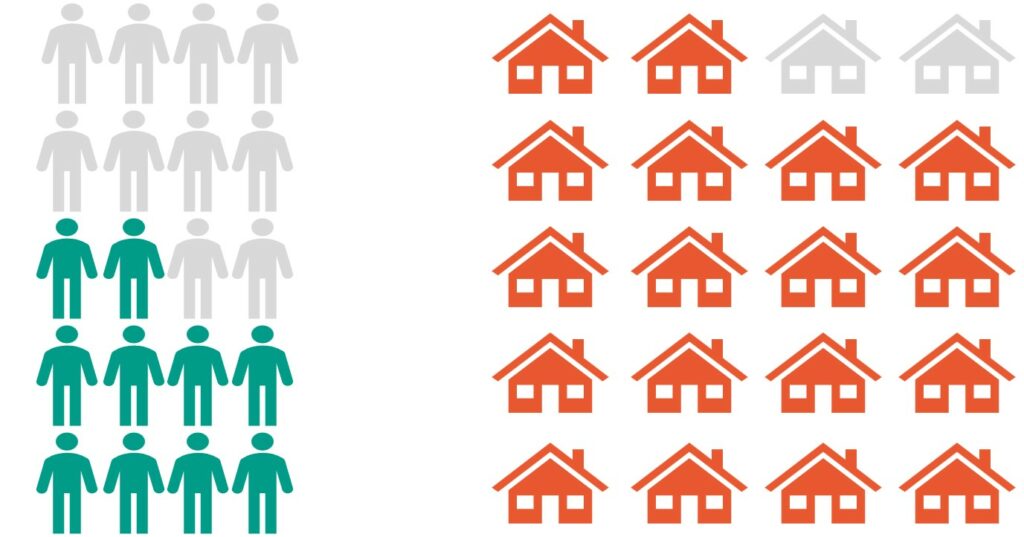
Affordable housing is defined as a household where the occupants plan to spend no more than 30% of their income on housing. Recent data shows that housing unaffordability is escalating in our region. Median home prices and rents have increased much faster than median household incomes. Over the last two years, median home prices increased by 54% and median apartment rents increased by 26%. Based on annual household income metrics, it’s estimated that 90% of homes for sale in our region are unaffordable for half of our region’s households as visualized in the graphic below.5 The disparity between median home and rent prices and median household incomes is especially prevalent for older adult homeowners in our region.
How We Will Help
Centralina will advise communities on how to support a diversity of housing types and augment the overall housing supply in our region to increase affordability. By seeking grant dollars to support projects ranging from housing preservation to housing innovation, Centralina is committing to bolstering affordable housing in our region for all. Moreover, Centralina will continue to support the facilitation of important community conversations and forums concerning community economic development and affordable housing through Centralina Learns and other community forums. Cost of living issues can further be addressed by increasing high wage jobs that boost household income and encouraging the development of affordable housing close to job centers.
Environment & Health
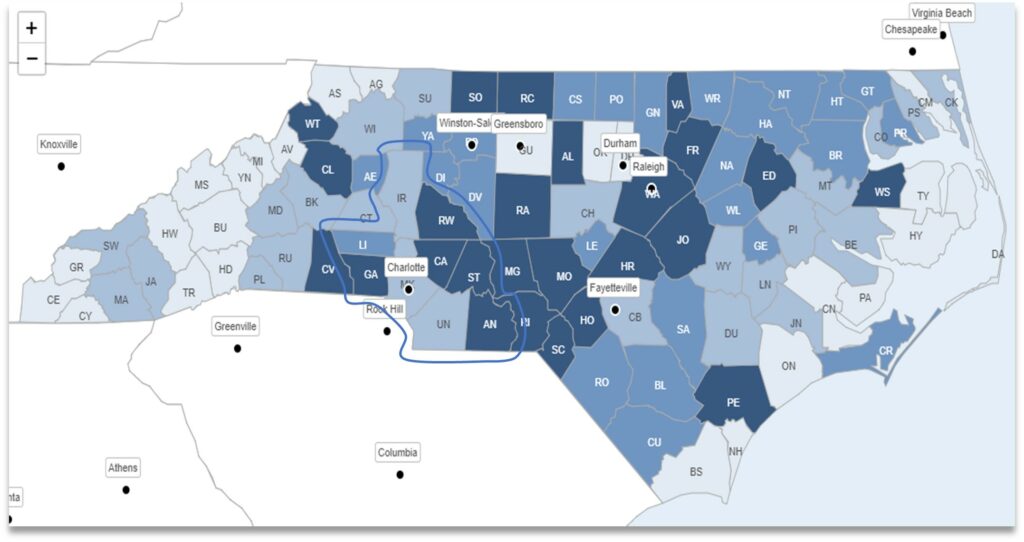
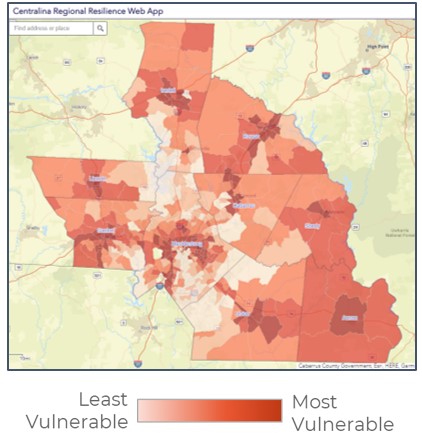
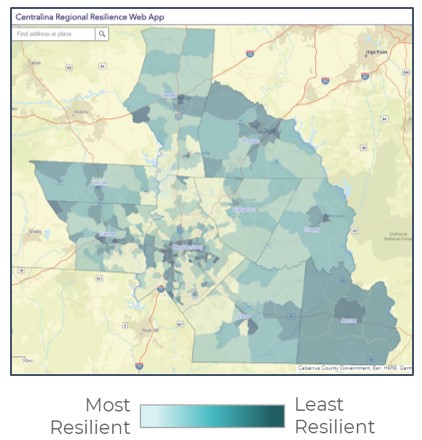
We see similar geographic patterns when it comes to our ability to bounce back from disasters and disruption. The red map below visualizes the Center for Disease Control’s social vulnerability index. The more intense the red color indicates communities that are vulnerable to disaster and may need support before, during or after events. The blue map below shows the Census Bureau’s community resilience estimates, which tracks the level of risk by measuring community capacity to respond and recover from external stresses imposed during a disaster. Generally, communities that experience less prosperity and worse health outcomes also rank as being more vulnerable and less resilient. The geographic distribution of wealth (and lack thereof) across our region has tangible impacts on a community’s ability – and the entire region’s ability – to respond to unforeseen challenges. This emphasizes the importance of proactive regional collaboration to improve resiliency and ensure we can recover from unexpected events and disruptions.
How We Will Help
There are opportunities for regional collaboration in support of local goals to improve health outcomes and resiliency indicators. These goals are supported by the Centralina Regional Resilience Collaborative, an initiative that examines the viability and resiliency of local emergency management disaster recovery plans and economic resilience needs to ensure the region benefits from greater efficiency in recovery. We also plan to strengthen regional partnerships and foster collaboration on resilience, recovery and environmental stewardship initiatives in other ways, as noted in strategy two under goal one of our workplan. For example, the Centralina team will develop Digital Inclusion Plans in all nine counties to bolster broadband access across the region. Regional long-term recovery and digital inclusion planning will sustain resilient communities who will be prepared to respond to current and future natural and man-made disasters and economic shocks. Additionally, all 16 councils of governments received state funding to support their local units in successfully navigating financial reporting and compliance requirements of disaster recovery funds. Through these projects, Centralina is committed to supporting local governments in effectively managing and building capacity for local and regional disaster recovery, mitigation and resiliency efforts.
Conclusion
These data points exhibit a glimpse into some of the important regional trends that shape Centralina’s work. Through regular data analysis of issues pertaining to our region, Centralina aims to identify current issues, as well as trends on the horizon. This allows Centralina to forecast and prepare the region and our communities for imminent and future matters. To learn more about our forementioned goals and priorities in the coming year, view our FY2023-2024 workplan.
Source Material
- 2010-2021 ACS 5-Year Estimates
- Comprehensive Economic Development Strategy 2023-2028
- MyFutureNC
- Census Housing and Transportation Data by CBS

Related Posts